Drive south on the 5 and the coastal cities of Orange County can blur into one long stretch of beach towns, harbors, and hillside neighborhoods. Yet if you look at how each market actually behaves, the differences are real. Some cities sell quickly; others take months. Some close right at asking price; others leave more room to negotiate. Some have seen steeper gains over the past decade.
This article puts six coastal markets side by side using an October 2026 snapshot, explains what the numbers suggest, and offers a practical way to use the comparison when you're deciding where to buy or when to sell. It leans toward San Clemente because that's the market we know best, but we've tried to be fair to its neighbors. Every one of these places is a great place to live, and the right answer depends on your priorities.
A note on interpretation: market-wide indicators describe the typical listing in a city, not the specific home you're considering. A beachfront property and an inland tract home in the same city can behave very differently. Treat the data as a map of the terrain, not a prediction for your house.
How do San Clemente, Dana Point and San Juan Capistrano compare?
San Clemente has the shortest expected time to sell at 84 days and closes at about 100% of list, San Juan Capistrano sits at 117 days and 100.3%, and Dana Point at 173 days and 98.1%.
| City | Expected time to sell | Listings with price cuts | Sale vs. list | 10-year value growth |
|---|---|---|---|---|
| San Clemente | 84 days | 43% | 100.0% | +118% |
| San Juan Capistrano | 117 days | 45% | 100.3% | +98% |
| Dana Point | 173 days | 33% | 98.1% | +116% |
| Newport Beach | 197 days | 38% | 98.0% | +123% |
| Laguna Beach | 213 days | 41% | 95.0% | +92% |
| Newport Coast | 223 days | 31% | 96.6% | +133% |
The first thing that jumps out is the speed column. San Clemente's expected time to sell is 84 days, while Newport Beach is 197, Laguna Beach 213, and Newport Coast 223. San Juan Capistrano sits at 117 days and Dana Point at 173. A shorter time to sell generally signals strong, steady demand relative to supply, though it can also reflect a different mix of price points.
How to read each column
Each column describes a different side of market behavior: how long a typical listing takes to sell, how often sellers cut prices, how close sales close to asking, and how much values rose over ten years.
Expected time to sell
This estimates how long a typical listing takes to find a buyer. It's a useful proxy for how competitive a market feels. If you're a buyer, a shorter time means you may need to move faster on good homes. If you're a seller, it suggests how long you might wait for the right offer.
Share of listings with price cuts
Between 31% and 45% of listings in these cities carry a reduction. In San Clemente the share is 43%. A high percentage can mean sellers frequently start too ambitious, which opens opportunities for buyers who do their homework. It also warns sellers that testing the market high often backfires.
Sale price versus list price
San Clemente (100.0%) and San Juan Capistrano (100.3%) show homes closing right at asking, or very slightly above. Dana Point (98.1%), Newport Beach (98.0%), and Newport Coast (96.6%) sit a bit lower, and Laguna Beach shows 95.0%. In practical terms, a lower ratio suggests buyers in those cities have had more negotiating room on average.
Ten-year value growth
Over a decade, all six cities posted strong gains, from about +92% in Laguna Beach to +133% in Newport Coast. San Clemente's +118% sits in the middle-to-upper range. Past growth doesn't guarantee future results, but it does show how durable coastal demand has been.
What stands out about each city
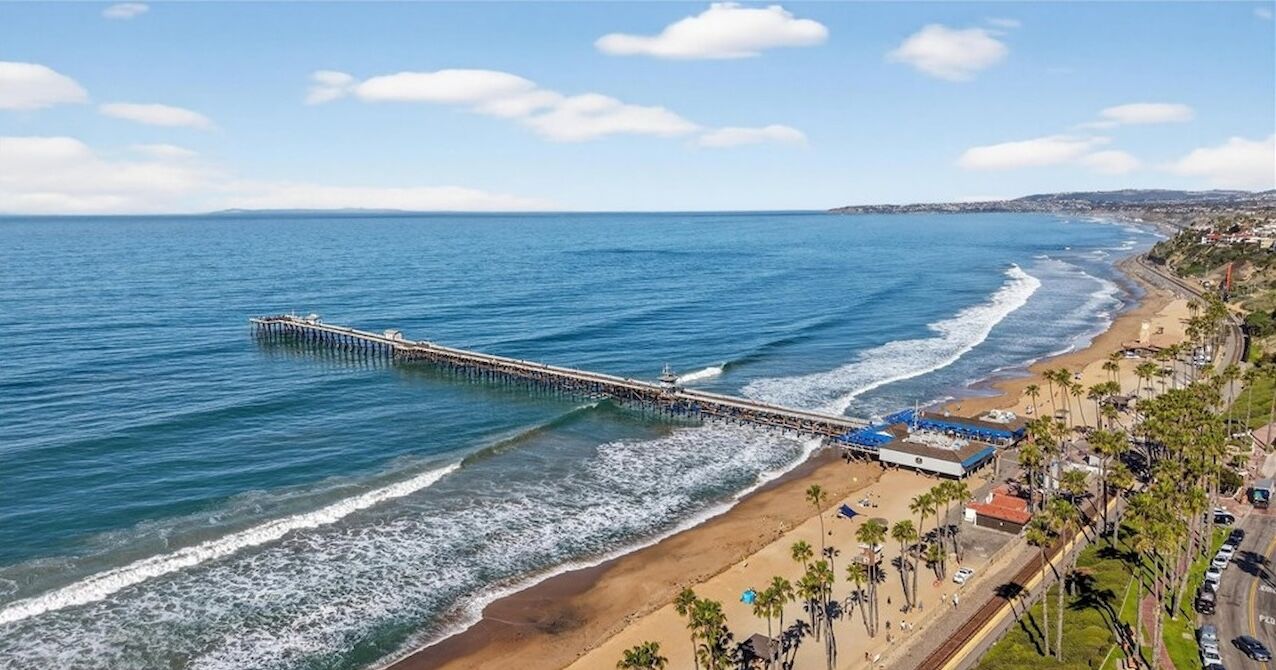
San Clemente stands out for the fastest expected time to sell (84 days) at about 100% of list, San Juan Capistrano is its closest match on pace and pricing behavior, and Dana Point is slower at 173 days with fewer price cuts.
San Clemente
San Clemente pairs the fastest expected time to sell in this group with a sale-to-list ratio at 100%. It's known as the "Spanish Village by the Sea," with a walkable Downtown, a pier that opened in 1928, and a beach trail along the shoreline. About 70% of its inventory is single-family homes, and the median sits around $2M. If you want a lived-in coastal town rather than a resort feel, it's a strong candidate. Start with our neighborhood guides and the lifestyle guide.
San Juan Capistrano
San Juan Capistrano is the closest match to San Clemente on pace and pricing behavior: 117 days expected time to sell, 100.3% sale-to-list, and the highest share of price cuts in the group at 45%. It's a little inland, with a historic mission and a quieter feel. If you like the idea of coastal access without living right on the sand, it's worth a visit.
Dana Point
Dana Point has a harbor-town identity and a market that takes longer to move: 173 days expected time to sell, 98.1% sale-to-list, and a smaller share of price cuts at 33%. A lower share of cuts alongside a longer time to sell often points to sellers who are patient and holding firm, but buyers who are choosy.
Newport Beach and Newport Coast
The Newport markets show longer times to sell (197 and 223 days) and lower sale-to-list ratios (98.0% and 96.6%), with ten-year growth of +123% and +133%. These are larger, higher-priced markets with a different buyer pool, so direct comparisons with San Clemente should be made carefully.
Laguna Beach
Laguna Beach combines the longest expected time to sell in the group (213 days) with the lowest sale-to-list ratio (95.0%) and the smallest ten-year gain (+92%). It's a distinctive, art-oriented coastal enclave where individual homes can be unusual, which makes market-wide statistics a rougher guide.
| City | Time to sell | Sale vs. list | Price cuts | Ten-year growth | In a sentence |
|---|---|---|---|---|---|
| San Clemente | 84 days | 100.0% | 43% | +118% | Fastest in the group, closing at asking |
| San Juan Capistrano | 117 days | 100.3% | 45% | +98% | Closest match on pricing behavior |
| Dana Point | 173 days | 98.1% | 33% | +116% | Slower, with fewer price cuts |
| Newport Beach | 197 days | 98.0% | 38% | +123% | Larger, higher-priced market |
| Laguna Beach | 213 days | 95.0% | 41% | +92% | Most negotiating room on average |
| Newport Coast | 223 days | 96.6% | 31% | +133% | Strongest long-term growth of the six |
Tell Alex your budget and priorities and he'll put recent sales side by side for you. Talk to Alex
How to use this comparison if you're buying
Buyers should use it to match their strategy to the market: be pre-approved and ready to move in a fast, close-to-list market, and take more time with comps in a slower, more negotiable one.
- Choose your lifestyle first. Walkability, harbor access, lot size, and newer versus older homes matter more than a city-level statistic.
- Set a budget and stick to it. Include property taxes, insurance, and any HOA dues. Master-planned areas often carry dues, so ask early.
- Match your strategy to the market. In a fast, close-to-list market, be pre-approved and ready to move. In a slower, more negotiable market, take your time with comps and ask for concessions where appropriate.
- Visit at different times. Beach towns feel different on a weekday morning and a summer weekend. Check parking and traffic.
- Ask for local comps. Request recent closed sales within a few blocks, not city averages.
Curious how your home would fare in today's market? Get a free, no-obligation valuation. Request a valuation
How to use it if you're selling
Sellers should use it to price to the market and plan for realistic timelines, since 31% to 45% of listings in these cities take price cuts.
- Price to the market, not to your hopes. With 31% to 45% of listings in these cities taking cuts, overpricing is the most common mistake.
- Expect different timelines. A listing in San Clemente has historically moved faster than in several neighboring markets, but you should still plan for a couple of months.
- Prepare early. Repairs, staging, and photography take time. Starting before you list shortens the path to a strong first week.
- Understand your net. Estimate commission, closing costs, and your mortgage payoff so there are no surprises.
Want an honest read on what your home could sell for? Request a free valuation
Leaning toward San Clemente? Browse current listings, compare neighborhoods, or talk it through with Alex.
Pace versus price: what the pairing tells you
Speed and sale-to-list together describe how much leverage each side holds, which is why the most useful way to read this table isn't one column at a time but in pairs.
| Profile | Cities | What it suggests | Strategy |
|---|---|---|---|
| Fast and close to list | San Clemente, San Juan Capistrano | Buyers and sellers are roughly aligned | Prepare early; well-priced homes move |
| Slower and below list | Newport Beach, Newport Coast, Laguna Beach | More leverage for buyers on average | Be patient; negotiate with comps |
| In between | Dana Point | Firm sellers and selective buyers | Price carefully and expect moderate timelines |
Neither profile is better in the abstract. A seller generally prefers the first; a buyer with time and flexibility may prefer the second. What matters is knowing which environment you're in so your strategy matches it.
Timing matters as much as the city
Timing matters, but your own calendar and circumstances matter more than the market's seasonal rhythm. Coastal markets have rhythms. Spring and early summer typically bring the most activity as buyers try to settle before the school year or the holidays, while late fall and winter tend to be quieter. A quieter season can mean less competition for buyers and fewer showings for sellers. The right move depends on your own calendar, not on the calendar of the market.
If you're flexible, consider these questions: Do you need to be in a house by a particular date? Are you selling one home to buy another? Would you rather compete in a busy season or negotiate in a slower one? Your answers matter more than any statistic, and a good agent will plan around them.
A cost-of-ownership checklist to run in every city
In every city, check property taxes, HOA dues, special assessments, insurance, maintenance, and commute and parking. Two homes with the same price can cost very different amounts to own. Before you fall in love with a listing in any of these cities, run through the same checklist so you can compare fairly.
| Item | What to ask | Why it matters |
|---|---|---|
| Property taxes | An estimate based on your purchase price | The seller's current bill may be lower |
| HOA dues | What they cover and how often they change | Changes the real monthly cost |
| Special assessments | Any recurring district or special taxes | Often hidden in listing totals |
| Insurance | Quotes early, especially coastal and hillside | Premiums vary by location |
| Maintenance | Age of roof, systems, exterior | Coastal air is hard on exteriors |
| Commute and parking | Your real route at rush hour | Daily life cost beyond the price |
For general guidance on homebuying costs and mortgage shopping, the Consumer Financial Protection Bureau's Owning a Home tools are a helpful independent resource, and the California Department of Real Estate explains your rights and licensing information.
Beyond the market data: lifestyle differences
Day to day, these cities feel different: San Clemente's beach trail, pier, and Downtown give it a small-town rhythm, and the numbers only tell part of that story. You can explore it in our guides to beaches, parks and trails, and local food and drink. For practical tips on living here, see our guide to moving to San Clemente.
If you want the official picture of the city, the City of San Clemente website is a good starting point, and Wikipedia's San Clemente entry offers background on history, climate, and transportation.
Leaning toward San Clemente? Explore the six neighborhoods before you tour. Explore neighborhoods
Getting around the region
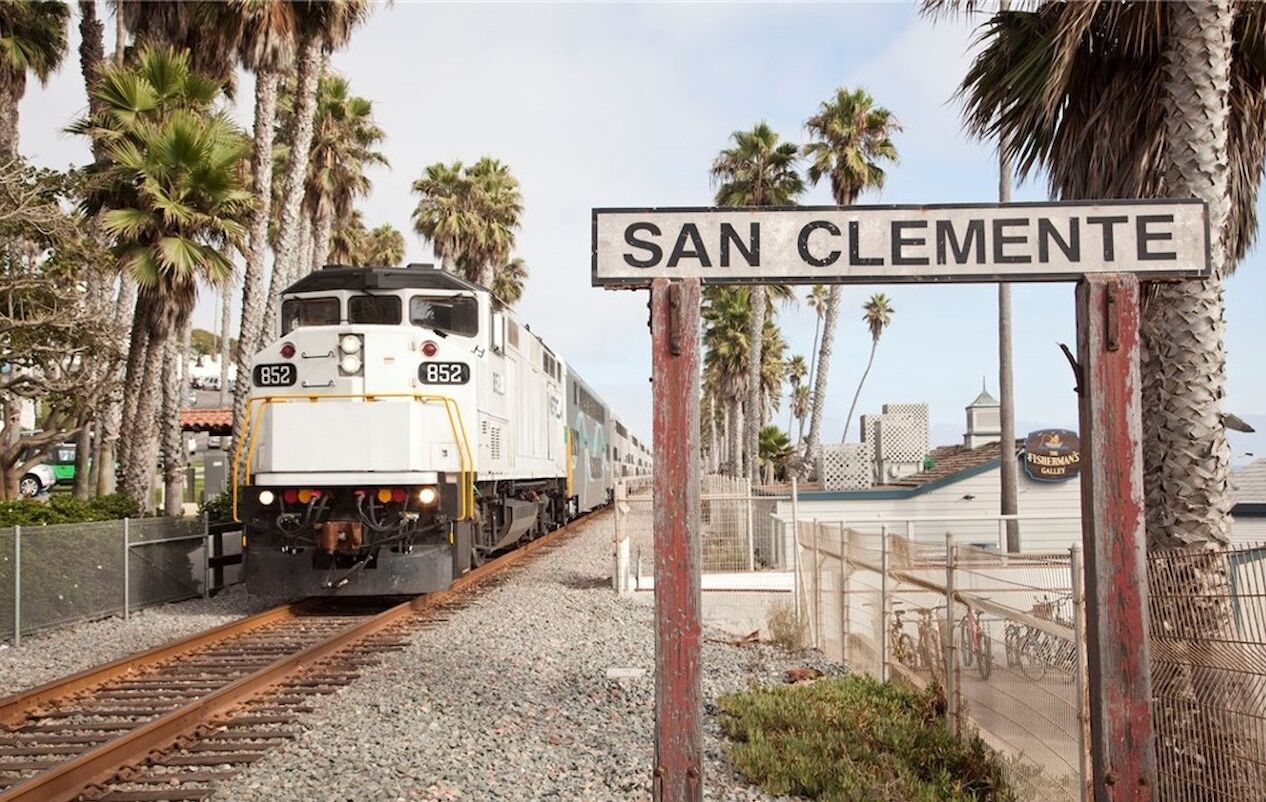
You can get around the region by car on the I-5, by train on the Amtrak Pacific Surfliner and Metrolink, and by local bus. Where you live on this stretch of coast shapes how you move through the region, and transportation options differ from town to town. San Clemente is served by the Amtrak Pacific Surfliner and by Metrolink, with stations in town, which makes trips north toward Orange County and Los Angeles or south toward San Diego possible without driving. You can check routes and schedules on the Pacific Surfliner and Metrolink sites.
For local buses, the Orange County Transportation Authority publishes routes and timetables. Even if you plan to drive most days, it's worth knowing the rail and bus options, since they can make a long commute or an event day far easier. The I-5 is the main artery for all of these cities, so test your own drive at the hours you'd actually travel before you decide where to buy.
- If you commute north: compare door-to-door times at rush hour from each city, not just distance.
- If you travel often: train access can matter more than a few extra minutes on the freeway.
- If you work from home: you may care more about daily walkability than commute routes. Our moving guide covers that tradeoff.
Want a current listing search and recent sales side by side for the cities you're considering?
What the fine print on a listing can teach you
Real listings show what sellers believe buyers value in each place, including what a listing leaves out. Comparing cities on statistics is useful, but the best education comes from reading real listings side by side. Pull up three or four active listings in each city at a similar price and look at what they emphasize. Do they highlight walkability and the beach, or lot size and amenities? How long have they been on the market, and have they reduced the price? Those details show you what sellers believe buyers value in each place.
Pay attention to what's missing, too. If a listing doesn't mention HOA dues or special assessments, ask. If photos avoid the street view, visit. If a property says 'ocean view', confirm what that means from the living room rather than from a rooftop. Our neighborhood guides include the questions to ask for each area of San Clemente, and the Pier Bowl vs. Talega comparison shows how two very different parts of one city can feel.
Finally, use the free valuation tool if you own a home elsewhere and are thinking of trading up to the coast. Knowing your starting equity turns a daydream into a plan, and it helps you decide which of these markets your budget fits most comfortably.
Seven questions to ask yourself before choosing a city
Ask yourself about your normal Saturday, how much house you need, how you feel about driving, how much maintenance you can take on, whether you want shared amenities, how long you'll stay, and your commute. Data narrows the field, but a decision this big comes down to how you want to live. These questions tend to clarify things quickly.
| Question | Why it matters |
|---|---|
| What does a normal Saturday look like? | Beach, harbor, galleries, or trailheads point to different towns |
| How much house do you need? | Lot size varies a lot between coastal cores and inland communities |
| How do you feel about driving? | Some areas are walkable; others are car-based |
| How much maintenance can you take on? | Vintage charm brings projects; newer homes have fewer surprises |
| Do you want shared amenities? | They usually come with HOA dues |
| How long will you stay? | Short and long holds call for different priorities |
| What's your commute? | Test it at rush hour before you commit |
Write your answers down, rank them, and then see which city and which neighborhood fits the top three. Many buyers discover that the right city is obvious once they stop asking which one has the best statistics and start asking which one fits their weekly routine.
Planning a move to the coast? Read our honest relocation guide. Read the moving guide
Limits of this data
This data is useful context but limited: it is a single October 2026 snapshot from one source, covers homes under $5M only, and uses an estimated rather than actual time to sell. Good analysis includes honesty about limitations. Here are the caveats to keep in mind:
| Limitation | What it means for you |
|---|---|
| Single October 2026 snapshot and source | Other reports may differ; verify before big decisions |
| Homes under $5M only | The most expensive homes are excluded |
| Expected time to sell is an estimate | It isn't the same as actual days on market |
| Small sample sizes | Neighborhood-level comparisons can mislead |
| Ten-year growth is historical | It doesn't predict the future |
None of that makes the data useless. It simply means you should treat it as context, then verify details for the specific home and street you're considering.
Next steps
If you're leaning toward San Clemente, start with the neighborhood that matches how you want to live: Downtown & Pier Bowl for walkability, Talega for planned amenities, or Forster Ranch for a hillside setting. If you're still comparing cities, bring your list and your budget to a conversation and we'll put real recent sales side by side. You can reach out through the contact form.
Frequently asked questions about this topic
Which coastal city sells the fastest?
In the October 2026 snapshot, San Clemente had the shortest expected time to sell at 84 days, followed by San Juan Capistrano at 117 days.
Do homes sell for more than asking in these cities?
On average, only slightly. San Juan Capistrano showed 100.3% sale-to-list and San Clemente 100.0%; the others were below 100%.
Which city has had the strongest long-term growth?
Newport Coast shows +133% over ten years, followed by Newport Beach at +123% and San Clemente at +118%.
Are price cuts a bad sign?
Not necessarily. They show that many sellers start high and adjust. For buyers they signal negotiating room; for sellers they're a warning about overpricing.
Why does San Clemente sell faster than Newport Beach?
There are several possible reasons, including a different mix of price points and buyers. The data shows the pattern but not the cause.
Where can I see the source data?
The figures come from a local San Clemente market report. Ask Alex for fresh MLS-based numbers.
Want a current San Clemente listing search, recent sales for your street, and a full carrying-cost comparison at your budget?

Alex Yu
My approach is simple: educate first, advise second. I'll give you an honest, block-by-block read on San Clemente so you can make the best-informed decision, whether you're buying, selling, or just exploring.
Further reading
Figures are from the cited sources and change over time. Confirm current details with Alex or the MLS before making decisions.