If you've been watching San Clemente prices, September gave you something to talk about. The median sale price for single-family homes climbed to $2,225,000, up from $2,085,000 a year earlier. That's a healthy move in a market where buyers have been stretched by borrowing costs and sellers have learned that pricing matters more than ever.
This update walks through the numbers, explains what each one actually means in plain English, and then translates them into practical moves for buyers and sellers. Along the way, you'll find illustrative scenarios (clearly labeled, and not real clients) to show how the same data plays out in different situations, plus links to neighborhood and lifestyle guides if you want to go deeper on a specific part of town.
A quick note on scope: San Clemente is a city of roughly 64,000 people, and only a few dozen single-family homes close in a typical month. That means every figure below is a snapshot, not a prediction. Use it to orient yourself, then get numbers for your specific street from a local agent.
What are the San Clemente housing market numbers right now?
As of September 2026, the single-family median sale price is $2,225,000, with 2.9 months of supply and an expected 84 days to sell, as the table below shows.
| Metric | Now | A year ago | Note |
|---|---|---|---|
| Median sale price | $2,225,000 | $2,085,000 | Sept 2026 vs. Sept 2025 (+6.7%) |
| Single-family closings | 43 | n/a | Sept 2026 (55 across all home types) |
| Active single-family listings | 105 | 130 | Sept 2026 vs. Sept 2025 |
| Months of supply | 2.9 | 3.2 | Sept 2026 vs. Sept 2025 |
| Expected time to sell | 84 days | 109 days | As of Oct. 1, 2026 vs. Oct. 2025 |
| Sale price vs. list price | 100.0% | n/a | All 55 closings in Sept 2026 |
| Listings with a price cut | 43% | n/a | Oct. 2026 snapshot, all price points |
If you only remember three numbers from that table, make them these: a $2.225M median, 2.9 months of supply, and 84 days expected to sell. Together they describe a market that's expensive, fairly tight, and moving at a steady pace for homes priced in line with recent sales.
Want these numbers for your own street? Alex builds a free valuation from recent nearby sales. Get my free valuation
What each number really means
Each number measures one thing: the price level, how much inventory is available, how fast homes sell, how close sales close to asking, and how many sellers cut their price. Market reports are full of jargon, and the same word can mean slightly different things depending on who's calculating it. Here's a plain-English decoder for the metrics in the table.
Median sale price
The median is the middle price: half of the homes sold for more, half for less. It's more reliable than an average because a handful of very expensive sales can't skew it as much. Still, a median mixes everything together, from a modest bungalow a few blocks from the pier to a large view home on a bluff. It tells you about the market, not about your house.
Months of supply
Months of supply answers a simple question: if no new homes were listed, how long would it take to sell the current inventory at the recent pace of sales? At 2.9 months, San Clemente sits in a range many analysts describe as balanced to slightly seller-leaning. Under about three months tends to favor sellers; above six tends to favor buyers. Those thresholds are rules of thumb, not laws, but they help you read the room.
Expected time to sell
This is an estimate of how long a typical listing takes to find a buyer. The September figure was 84 days, down from 109 days in October 2025. Faster is generally good news for sellers. For buyers, it's a reminder that desirable homes can go under contract quickly, so you want your financing and your questions ready before you tour.
Sale-to-list ratio
This compares the final sale price with the original list price. September's figure was about 100%, meaning homes that closed did so close to asking. Notice what that implies: well-priced homes aren't being discounted heavily, but there's very little premium either. Pricing right from day one is the whole game.
Price cuts
Around 43% of listings in the October snapshot carried a price reduction. That sounds alarming until you remember it includes every price point and every listing that started a little ambitious. It's a signal that sellers who test the market high often end up adjusting, and that buyers have negotiating room on homes that have been sitting.
| Metric | Sept 2026 reading | What it measures | How to read it |
|---|---|---|---|
| Median sale price | $2,225,000 | The middle price of closed single-family sales | A guide to the market, not to your house |
| Months of supply | 2.9 | How long current inventory would last at the recent sales pace | Under about 3 leans toward sellers; over about 6 leans toward buyers |
| Expected time to sell | 84 days | Estimated time for a typical listing to find a buyer | Shorter means more competition for good homes |
| Sale-to-list ratio | About 100% | Final price compared with original list price | Near 100% means well-priced homes sell close to asking |
| Price-cut share | 43% | Listings that reduced their price | High share means many sellers start too high |
Want to see how these numbers play out on your street? Get recent sales, a listing search, and a straight read from Alex.
What changed compared with last year
Compared with September 2025, the median rose about 6.7% to $2,225,000, active listings fell from 130 to 105, and expected time to sell dropped from 109 to 84 days.
| Metric | Sept 2025 | Sept 2026 | Change |
|---|---|---|---|
| Median sale price | $2,085,000 | $2,225,000 | Up about 6.7% |
| Active listings | 130 | 105 | Down about 19% |
| Months of supply | 3.2 | 2.9 | Slightly tighter |
| Expected time to sell | 109 days | 84 days | 25 days faster |
| Sale-to-list ratio | n/a | About 100% | Homes close near asking |
Taken together, that's a market with modest but real momentum. It isn't the frenzy of a few years ago, and it isn't a slump. It's a market where preparation and pricing discipline separate smooth deals from stressful ones.
Why do monthly market figures bounce around?
Monthly figures bounce around because only a few dozen single-family homes close in a typical month, so the mix of homes that happened to close can move the median even when the market hasn't changed. Imagine a month where several oceanview homes close in the same weeks. The median jumps. The next month, more inland homes close and it drops. Nothing about the underlying market changed; the mix did. That's why seasoned agents talk about price per square foot, comparable sales on the same street, and multi-month trends rather than headlines about one month.
It's also why neighborhood-level medians are even noisier. A neighborhood might see only a handful of sales in a month, so one unusual home can swing the figure. If you're evaluating a specific area, the neighborhood guides explain what makes each one different, and a local agent can pull recent sales on your exact street.
Common mistakes when reading market reports
The most common mistakes are treating one month as a trend, assuming the median is your price, ignoring sample size, mixing sources, and confusing asking prices with sold prices.
| Mistake | Why it misleads | Do this instead |
|---|---|---|
| Treating one month as a trend | The mix of homes that closed can swing the median | Look at three to six months |
| Assuming the median is your price | It blends every type of home | Compare sales on your own street |
| Ignoring sample size | A few dozen closings can swing the number | Watch trends, not single data points |
| Mixing sources | Definitions and date ranges differ | Compare like with like |
| Confusing asking and sold prices | List prices are hopes, closed sales are facts | Use closed sales as your guide |
A good rule is to treat any report, including this one, as a starting point for conversation. The best decisions combine market data with a close look at the specific home, a clear view of your own budget and timeline, and an agent who is candid about what the numbers can and can't tell you.
| Signal | If you're buying | If you're selling |
|---|---|---|
| Median up about 6.7% | Budget realistically and compare closely | Momentum helps, but price to comps |
| Fewer active listings | Be ready to move on good homes | Less competition for your listing |
| 84 days to sell | Do not wait on well-priced homes | Plan for a couple of months |
| About 100% sale-to-list | Expect little discount on fair prices | Pricing right matters more than ever |
| 43% price cuts | Ask about price history on slow listings | Overpricing is the common mistake |
What does this mean if you're buying?
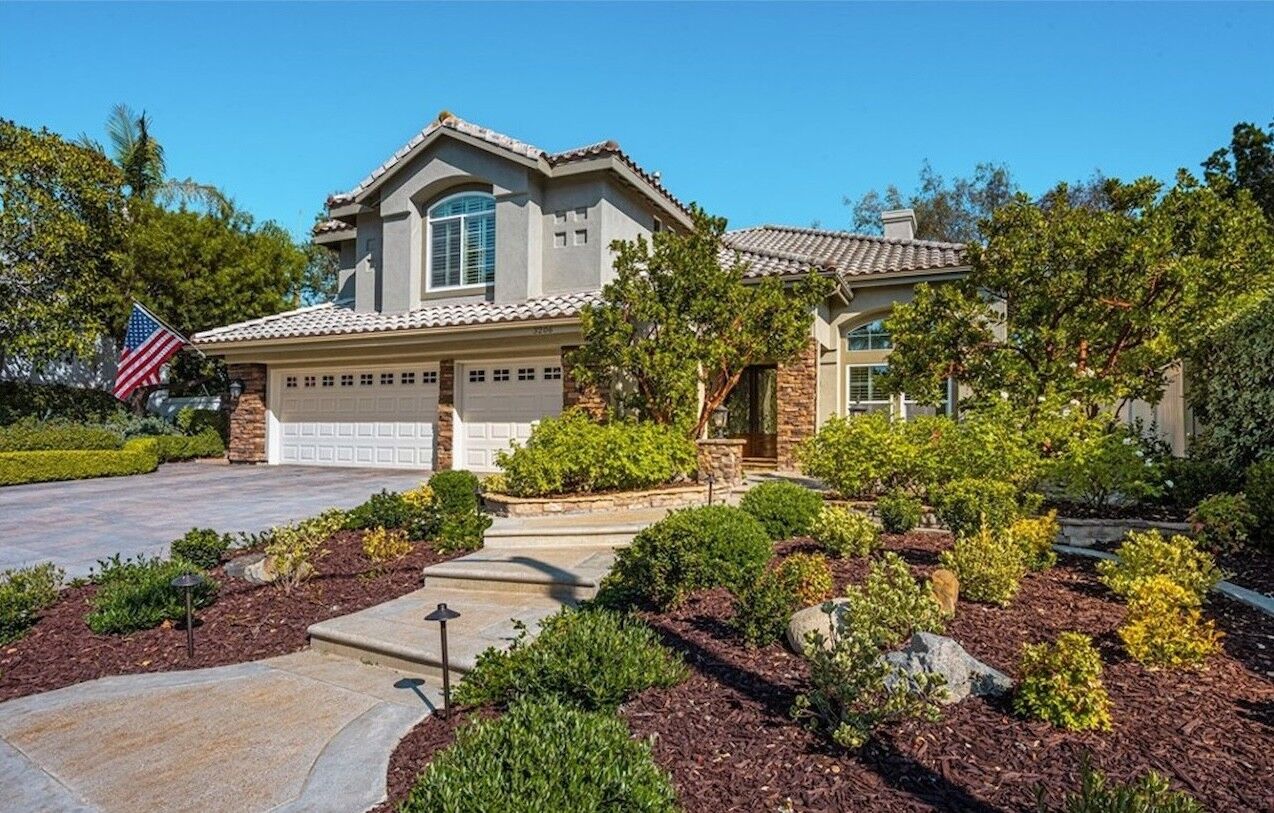
For buyers, this market rewards preparation: roughly four in ten listings have cut their price and homes are taking a couple of months to sell, so prepared buyers have some leverage, especially on homes that have been sitting. A median above $2M can feel intimidating, but the data also contains good news for prepared buyers. Roughly four in ten listings have cut their price, and homes are taking a couple of months to sell. Here's how to use that.
A buyer playbook
- Get fully pre-approved first. A pre-approval based on verified income and assets carries weight with sellers and tells you your real budget.
- Define your must-haves. Single-family homes make up about 70% of inventory, so you have choices. Decide what you won't compromise on: lot, view, walkability, or a newer build.
- Study comparable sales. Ask for the last several closed sales within a few blocks. With homes closing near list, comps tell you whether an asking price is realistic.
- Ask about price history. A listing that's been reduced signals flexibility. Ask how long it's been on the market and why the seller is moving.
- Budget the full cost of ownership. Property taxes, insurance, and any HOA dues change your monthly number significantly, especially in master-planned areas.
- Move quickly on the right house. Fewer listings means the best-priced homes in your criteria don't last long. Be ready to see them within days.
Thinking of selling? Get a pricing strategy based on what's actually closing. See what my home is worth
What does this mean if you're selling?
Fewer competing listings and a faster pace of sales are tailwinds for sellers, but they only help if your home is priced to the market. The sale-to-list ratio near 100% shows buyers aren't paying large premiums. The 43% price-cut figure shows what happens to homes that start too high.
A seller playbook
- Start with an honest valuation. Request a free home valuation built from recent nearby sales, not just an online estimate.
- Price for the first two weeks. The strongest interest comes right after listing. Pricing correctly at launch usually beats cutting later.
- Prepare the house. Repairs, paint, landscaping, and decluttering often return more than major remodels. Ask your agent which projects matter in your neighborhood.
- Invest in presentation. Professional photography and strong online marketing matter, because most buyers start their search on a screen.
- Understand your net. Work out agent fees, closing costs, and any payoff before you list, so you know what you'll walk away with.
- Plan your next move. If you're buying again, line up financing and timing so you're not squeezed between two transactions.
Curious what your home might sell for in this market? Get a free valuation
How San Clemente compares with nearby coastal cities
San Clemente's 84-day expected time to sell is notably shorter than several neighbors in the same October snapshot, including Dana Point and Newport Beach, which show expected times well above 150 days. San Clemente also closes at about 100% of list while some neighbors sit a few points lower. We unpack that comparison in San Clemente vs. Dana Point vs. San Juan Capistrano.
Be careful about over-reading city comparisons. Each city has a different mix of homes, price points, and buyer pools. They're useful for context, but your decision should rest on the specific home and neighborhood in front of you.
Not sure which part of town fits? Compare all six neighborhoods side by side. Compare neighborhoods
A neighborhood lens on the same numbers
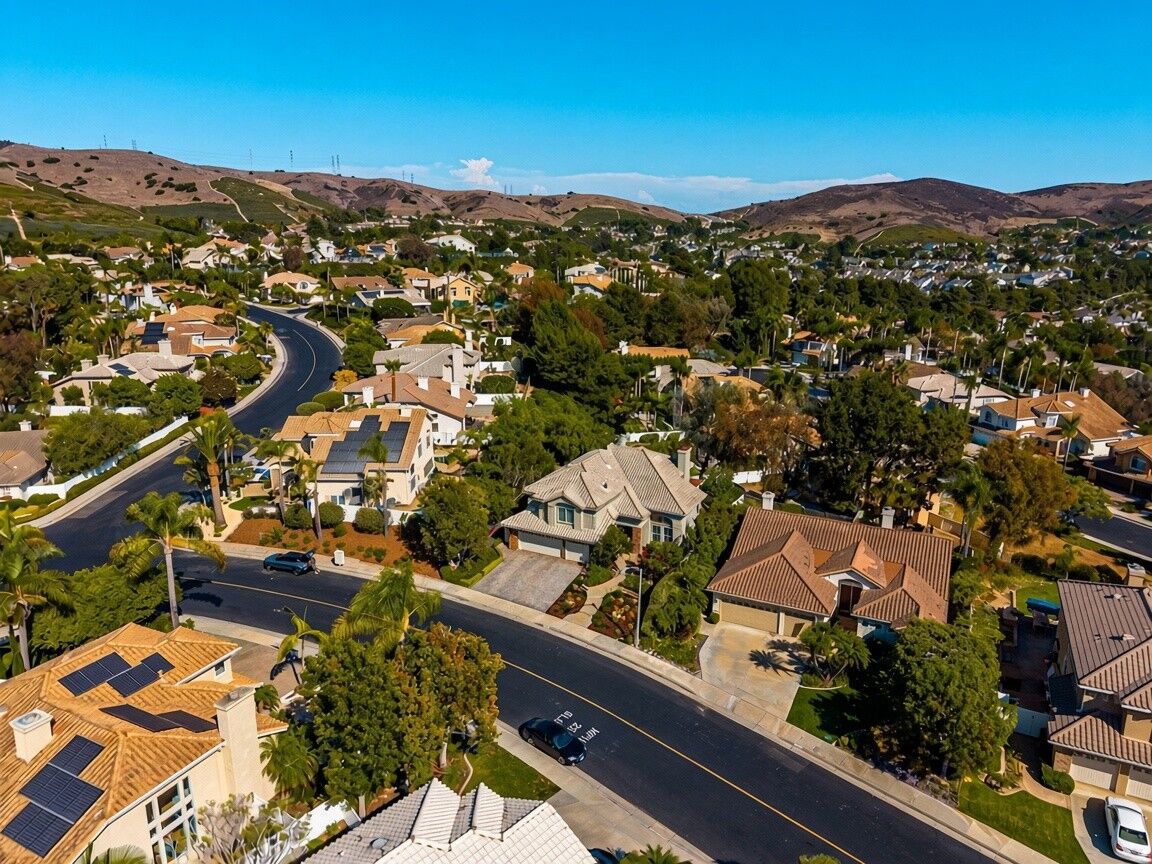
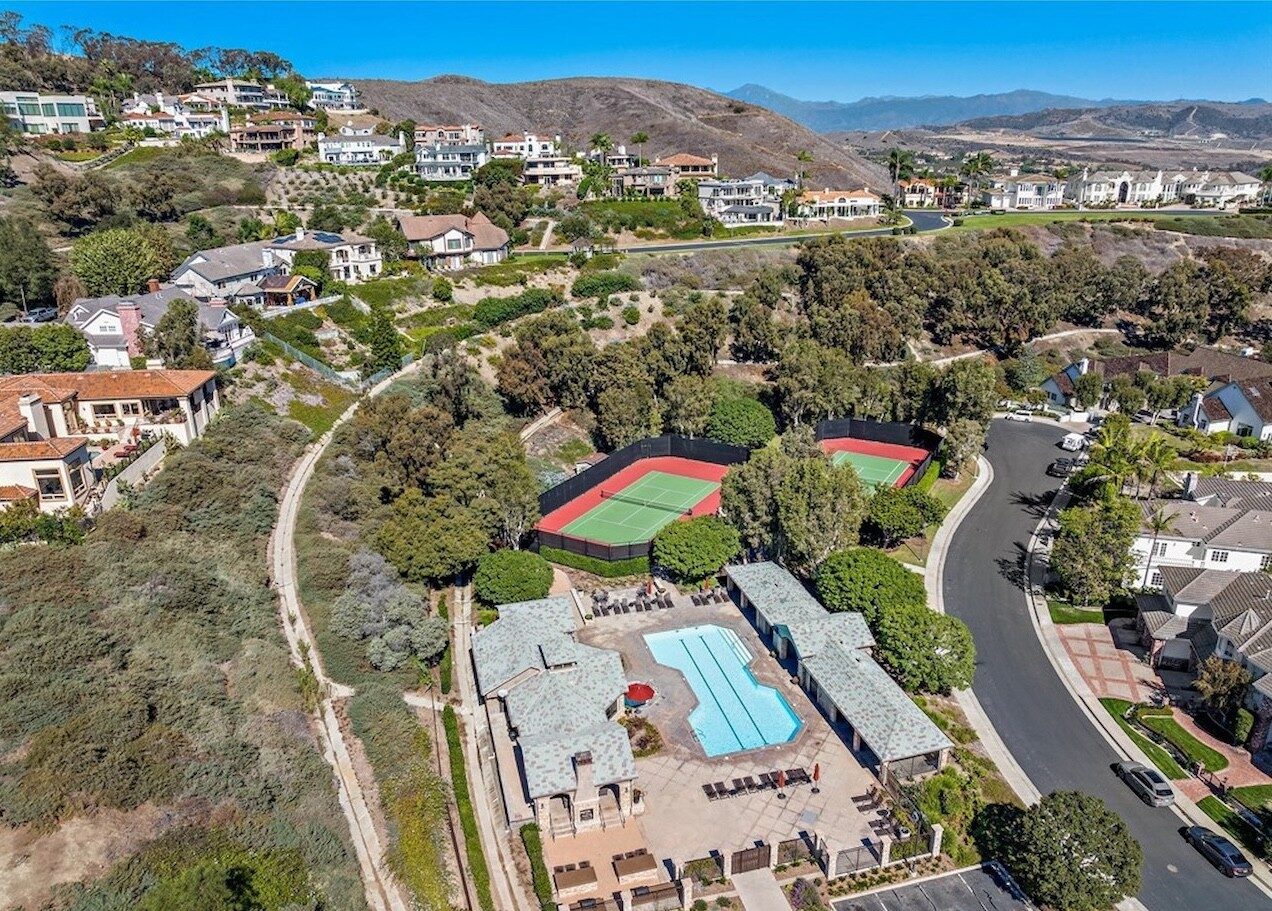
The numbers differ by neighborhood because each area's prices are driven by different factors, such as view, lot, size, and HOA costs. A citywide median blends very different parts of town. Here's how to think about it by area, using the neighborhood guides on this site:
| Area | Setting | What drives price | Guide |
|---|---|---|---|
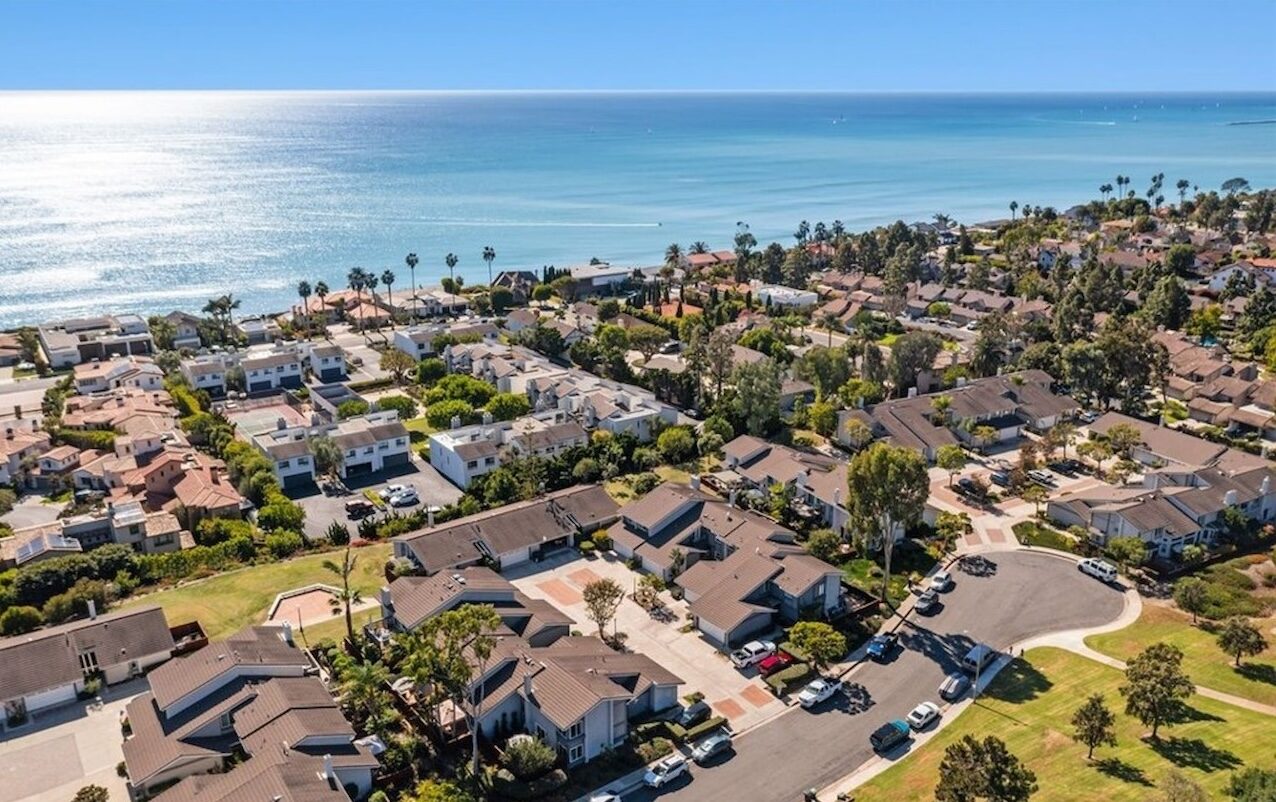
| Downtown & Pier Bowl | Coastal, walkable | View and distance from the sand | Read the guide |
| Sea Summit | Coastal bluff, newer construction | View quality by lot | Read the guide |
| Forster Ranch | Hillside planned community | Size, lot, and elevation | Read the guide |
| Shorecliffs | Established coastal-side neighborhood | Terrace, view orientation, and remodel level | Read the guide |
| Talega | Inland master-planned, 30+ neighborhoods | Tract, size, and HOA costs | Read the guide |
| Rancho San Clemente | Elevated hillside | Orientation and view | Read the guide |
For live listings and recent sales in each area, Redfin's neighborhood pages are a handy reference: see Talega, Forster Ranch, and Pier Bowl. Treat third-party medians as directional, since small sample sizes make them unstable.
Want a current San Clemente listing search and a cost comparison at your budget?
What to watch over the next few months
Over the next few months, watch active listings, months of supply, the share of price cuts, the sale-to-list ratio, and interest rates.
| Indicator | If it rises | If it falls |
|---|---|---|
| Active listings | More choice, more room to negotiate | Tighter market, more competition |
| Months of supply | Shifts toward buyers | Shifts toward sellers |
| Share of price cuts | Sellers are overreaching | Pricing is realigning with buyers |
| Sale-to-list ratio | Buyers are paying near or above asking | Buyers are regaining leverage |
| Interest rates | Fewer buyers can afford homes | Demand tends to firm up |
None of these will move in a straight line. Treat them as dials to monitor, not as predictions.
Beyond the numbers: why people choose San Clemente
People choose San Clemente for its small-town, Spanish Colonial character, with a pier that opened in 1928, a beach trail along the shoreline, and a walkable Downtown. Statistics describe the market, but they don't describe why people pay a premium to live here. If you want to understand the daily rhythm behind the data, explore our beaches guide, the parks and trails guide, and the food and drink guide.
For official city information, visit the City of San Clemente, and for historical background see San Clemente on Wikipedia.
Planning to buy? Tell Alex your budget and he'll show you what's realistic right now. Talk to Alex
How do interest rates affect affordability?
Interest rates change the monthly payment on the same purchase price: when rates rise, buyers can afford less, and when they fall, buyers can stretch further. Price is only half of the affordability story. The other half is the interest rate on the loan, which can change a monthly payment by hundreds of dollars on a loan this size. When rates rise, the same purchase price costs more each month, which can cool demand; when they fall, buyers can stretch further, which tends to firm up prices. That's why two markets with identical median prices can feel completely different depending on the rate environment.
If you're planning a purchase, run your own scenarios instead of relying on headlines. Ask a lender for a written loan estimate at your intended down payment, then ask what the payment would be at a quarter point higher and lower. The Consumer Financial Protection Bureau's Owning a Home tools walk through how rates, points, and fees interact, and they're written for consumers rather than professionals. For sellers, remember that your buyer pool is shaped by the same math: a rate move can widen or narrow the group of people who can afford your home.
- Compare lenders. Rates and fees vary, and a small difference on a large loan adds up over years.
- Understand rate locks. Ask how long a lock lasts and what happens if closing is delayed.
- Know your breakeven. If you're thinking of paying points to lower your rate, calculate how many years it takes to recover the cost.
- Plan for large loans. At San Clemente prices, many loans exceed conforming limits and have different requirements. Our buying guide explains what to ask.
How to double-check any market number yourself
You can double-check any market number by comparing it against a few other public sources and a local agent's MLS pull, keeping in mind that definitions and date ranges differ. A healthy habit with market data is verifying it. You don't need special software; you need a few reliable places to look and the patience to compare them. Start with the source we cited, the San Clemente market report, then cross-check with other public sources, keeping in mind that definitions and date ranges differ.
- Statewide context: the California Association of Realtors market data pages publish statewide and county-level statistics that help you see the bigger picture.
- Live listings: neighborhood pages on Redfin, such as Talega, Forster Ranch, and Pier Bowl, show current listings and recent sales, though small samples make medians jumpy.
- Official city information: the City of San Clemente publishes planning and project updates that can affect neighborhoods over time.
- A local agent's MLS pull: the most accurate comparison is recent closed sales near your home, which you can request through our free valuation or the contact form.
When two sources disagree, don't panic. Check the home types included, the dates covered, and whether the number is a median or an average. Most disagreements disappear once the definitions line up, and the rest are a reminder to treat any single figure as a range rather than a fact.
How to get numbers for your exact street
You get numbers for your exact street by combining recent closed sales within a few blocks, active competing listings, and a local agent's read on condition, view, and lot. Citywide statistics are a starting point. To get an accurate picture for your home or the one you want to buy, you need three things: recent closed sales within a few blocks, a clear view of active competing listings, and an experienced read on condition, view, and lot. That combination is what a local agent adds, and it's why a custom valuation beats an automated estimate.
If you're considering a move, reach out through the contact form or request a free home valuation. There's no obligation, and you'll get a straight answer about where you stand.
Frequently asked questions about this topic
What is the median home price in San Clemente?
The single-family median sale price was $2,225,000 in September 2026, up from $2,085,000 a year earlier, per a local market report. Monthly figures vary, so look at multi-month trends.
Is it a buyer's or seller's market in San Clemente?
With about 2.9 months of supply, the market leans balanced to slightly seller-friendly. Well-priced homes move, while overpriced homes often take price cuts.
How long does it take to sell a home in San Clemente?
Expected time to sell was about 84 days as of October 1, 2026, down from 109 days a year earlier.
Are prices going up or down?
Year over year, the single-family median rose about 6.7% in September. But June and July medians were near $1.88M, so don't read too much into one month.
How much of San Clemente's inventory is single-family?
About 70% of inventory is single-family homes, which is why this site focuses on houses.
How do I find out what my home is worth?
Request a free home valuation. It's built from recent nearby sales, plus your home's condition, lot, and view.
Want a current San Clemente listing search, recent sales for your street, and a full carrying-cost comparison at your budget?

Alex Yu
My approach is simple: educate first, advise second. I'll give you an honest, block-by-block read on San Clemente so you can make the best-informed decision, whether you're buying, selling, or just exploring.
Further reading
Figures are from the cited sources and change over time. Confirm current details with Alex or the MLS before making decisions.